

According to a research, almost 90 percent of marketing executives say that understanding user journeys across different channels and devices is critical to marketing success.
While customers have high expectations for personalized and relevant experiences from brands they engaged, Google is looking for ways to better measure customers' journey with all of its complexity.
Here, Google Analytics is updated to represent this. Google announces four enhancements that should help websites to better understand their users and what they are doing on your site. By analyzing the data, websites can understand the journey of customers, and know what's probably best for them.
This way, website owners and webmasters can work to create better experiences for them.
The four new Analytics features are all about helping businesses understand users so they can deliver more personalized site experiences. They are:
User-Focused Reporting
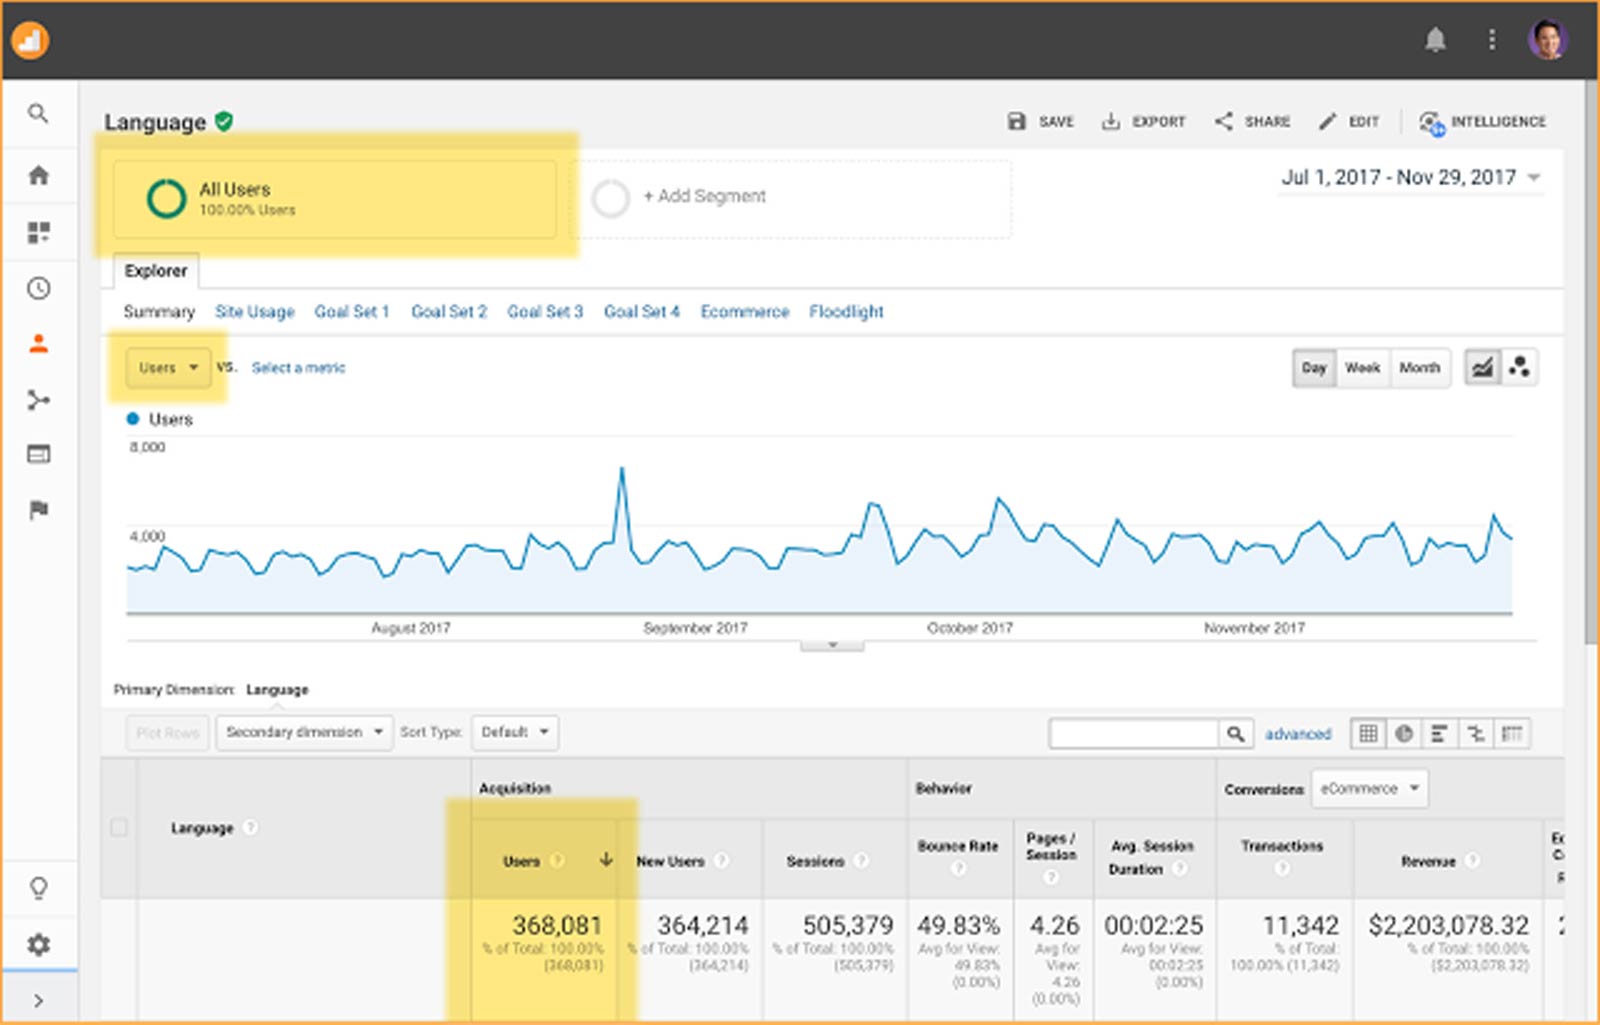
The standard reporting in Google Analytics has been updated to focus on users, to include "Users," instead of just "Sessions." User metrics are essential in understanding engagements, especially those who may have multiple sessions across multiple days.
This way, webmasters can see, for instance, how many users are coming to their your site from paid search, immediately - in addition to just seeing the number of sessions.
User data can also be further analyzed in other reports such as Active Users, Cohort Analysis and Lifetime Value.
This feature can be enabled in the Admin section, and then by going to Property Settings in users' Google Analytics account. Here, they can toggle the switch for "Enable Users in Reporting."
The data will then appear in the report view, as seen below:
Measuring Users' Metrics And Dimensions
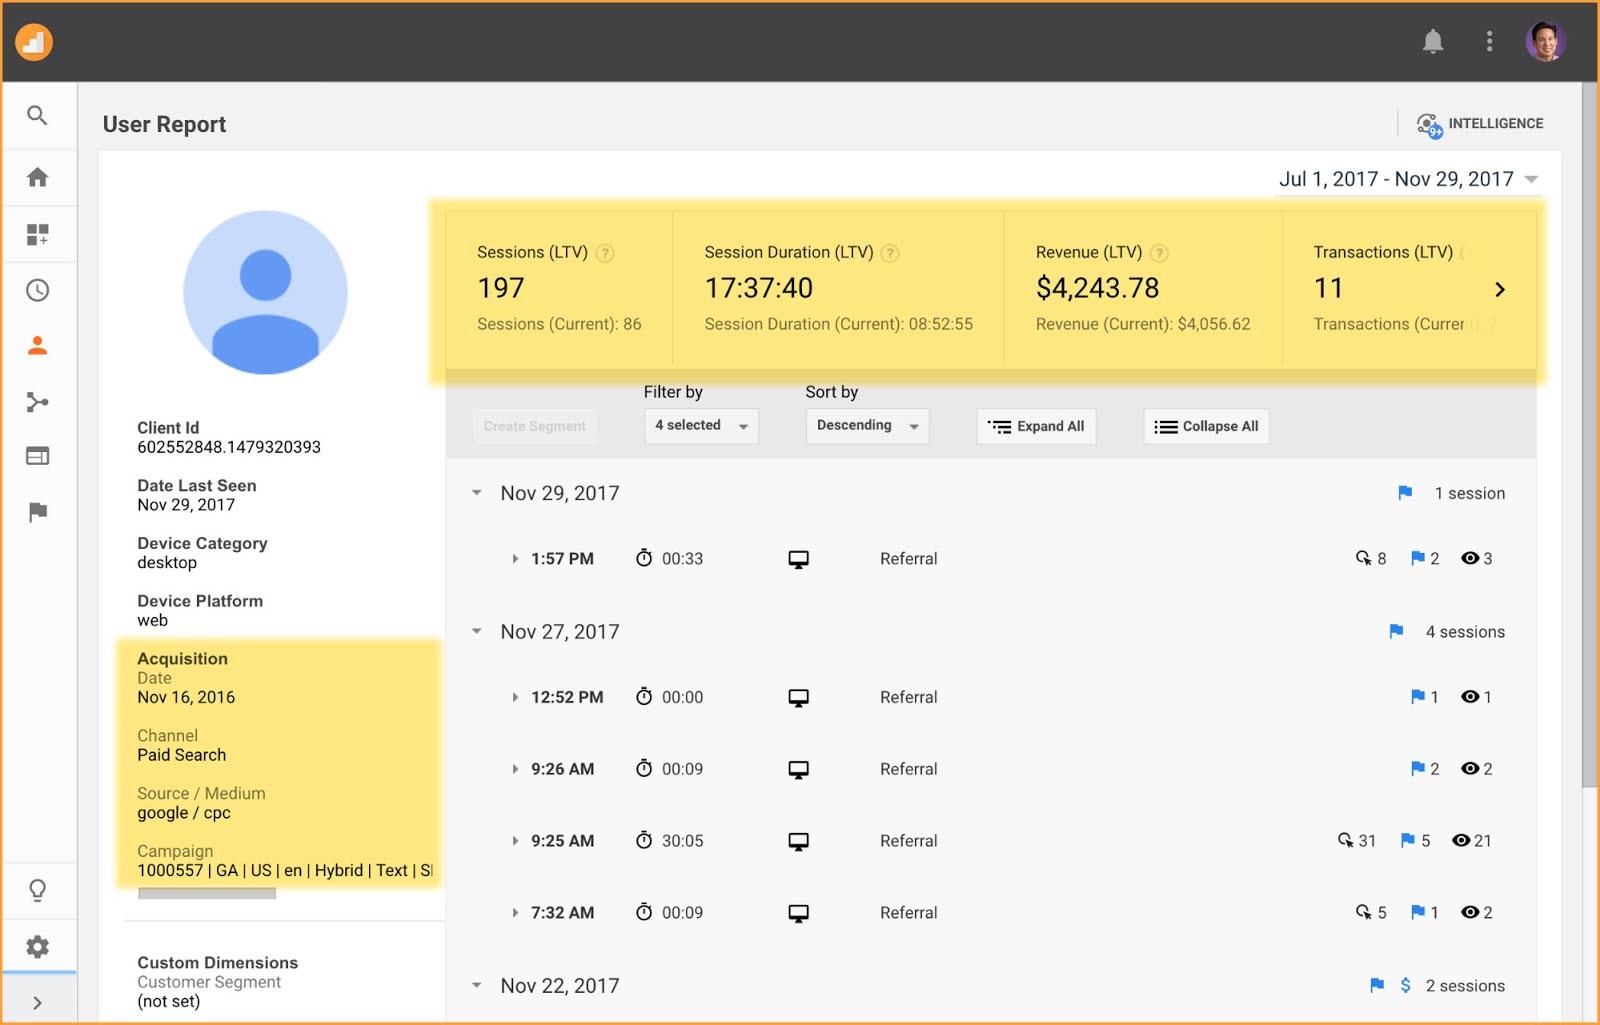
The update includes the 'User Explorer' tool which allows marketers to view the lifetime metrics and dimensions at the user level.
Based on the life of their cookie, this will open up new details to marketers, such as the number of transactions made, or the total time spent on the website. These metrics and dimensions should give Analytics users a much more detailed way to measure visitors and customers.
There is also a new dimensions that show data such as when a user made their first visit, and which channel acquired them.
Data for this report is available starting from March 9, 2016, and uses the top 10,000 users.
Audience Reporting
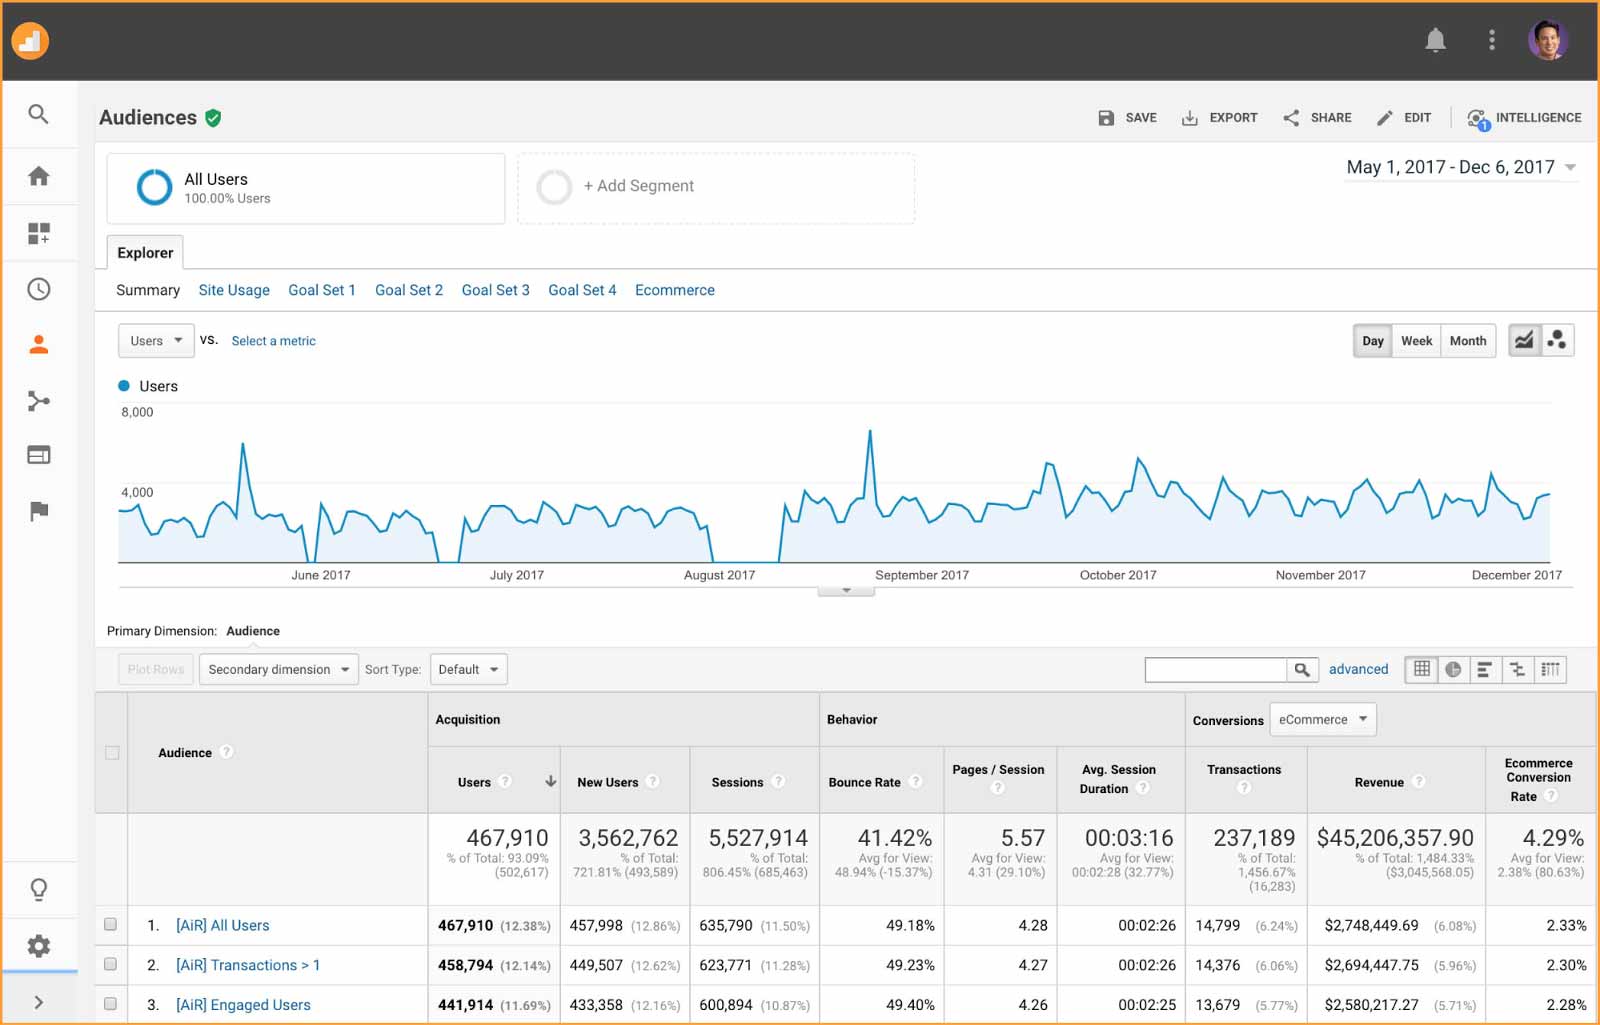
Google Analytics has added the option to publish any audience to a new report in Analytics that should help make every audience easier to understand.
Previously, Audiences could be created and published to other platforms such as AdWords, but there was no way to do this in Analytics. With the option to publish Audiences to reports, marketers can see a cross-channel view of their visitors.
For instance, marketers may decide to publish an audience to Analytics so that they can see all users who have purchased within the last 12 months but not during the last 2.
They can also be added as a secondary dimension in reports, and as a dimension in segments, custom reports and custom funnels.
Conversion Probability
Conversion Probability takes user-based metrics one step further to show marketers just what the name suggests: the probability that a given user will convert in the future.
Using machine learning model that is trained and learned from users who have made transactions in the past. the Conversion Probability is able to show who have a high likelihood to purchase, enabling marketers to reach those users through either advertising campaigns in AdWords and DoubleClick or site experiments in Optimize.
The advantage of using this is that marketers can create remarketing lists that target users
Analytics also adds Conversion Probability report which shows the Conversion Probability for all users, including across important dimensions such as channel.
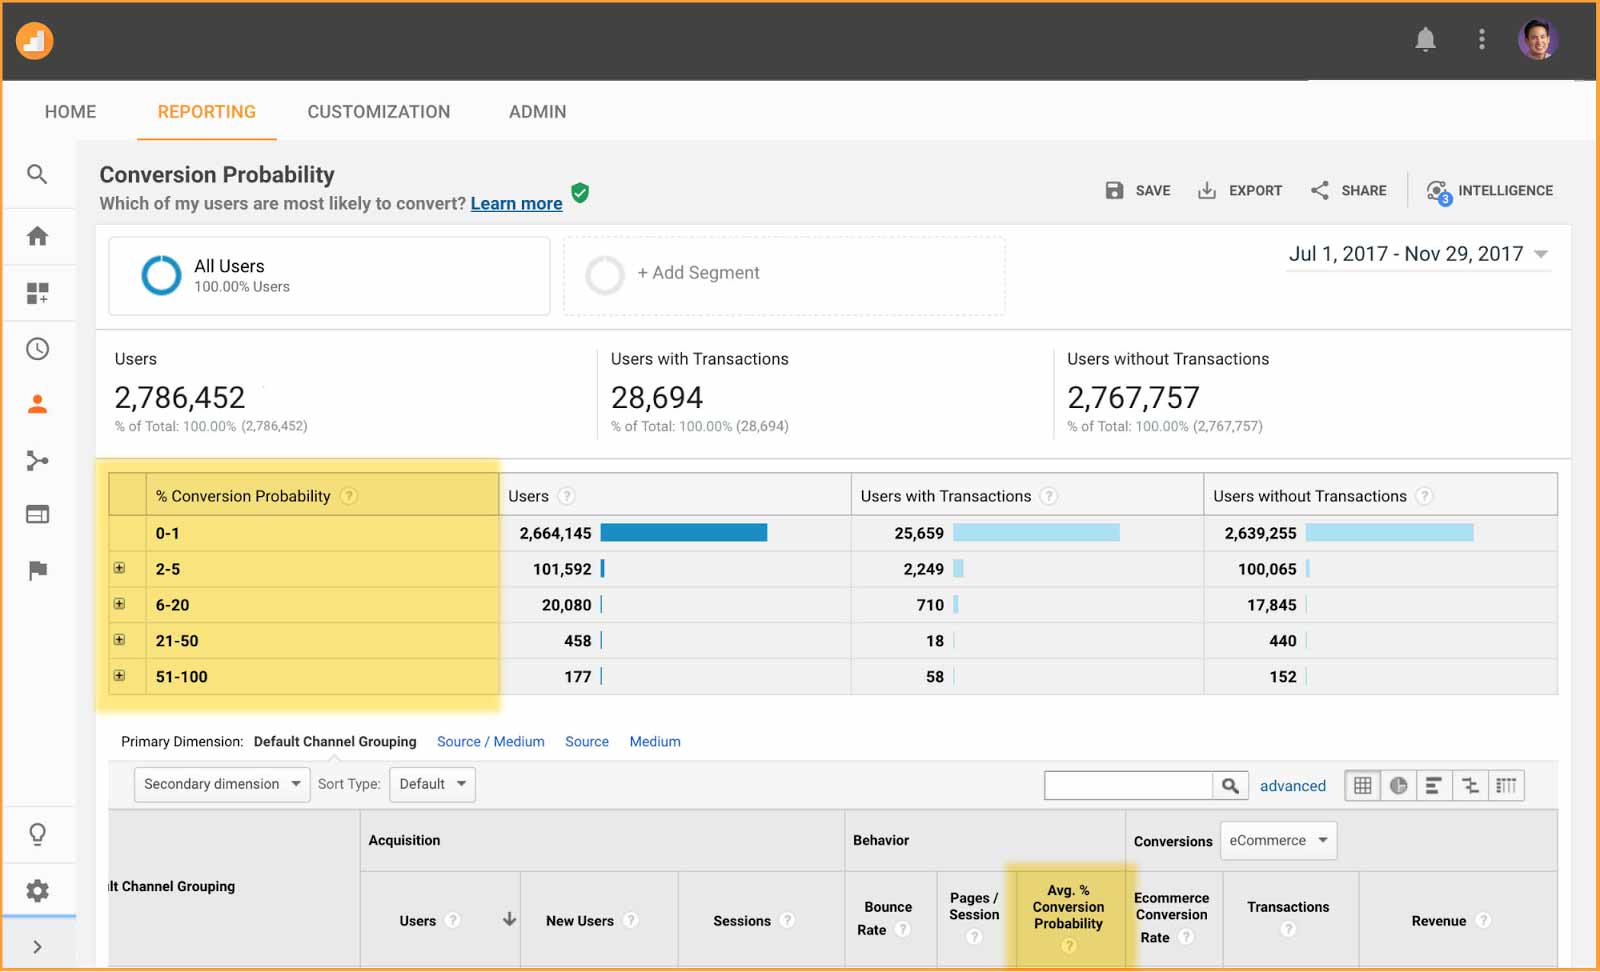
Conversion Probability is based by the same machine learning algorithms that power Smart Lists and Smart Goals. This calculation applies data from past transactions in order to give the probability that a user will convert in the future. Average Conversion Probability will be calculated related to a dimension in the date range that marketers have specified.
The minimum data threshold for calculating conversion probability is initially 1,000 a month, and then 30 days of data to model accurately. The score runs from 1 (least probable) to 100 (most probable).
Additionally, marketers can also publish those audiences to Google Optimize where they can get insights on site optimizations that could have the highest impact on conversions.